|
|
|
|
IRoPLUM
IRoPLUM is a collection ofPython scripts that implements the Simultaneous Iterative Reconstruction Technique. Intended to be used for reconstruction of 3D atmospheric density fields. Input is sinograms of densities from UV or IR cameras or DOAS instruments. IRoPLUM_0.0.1.tgz
|
|
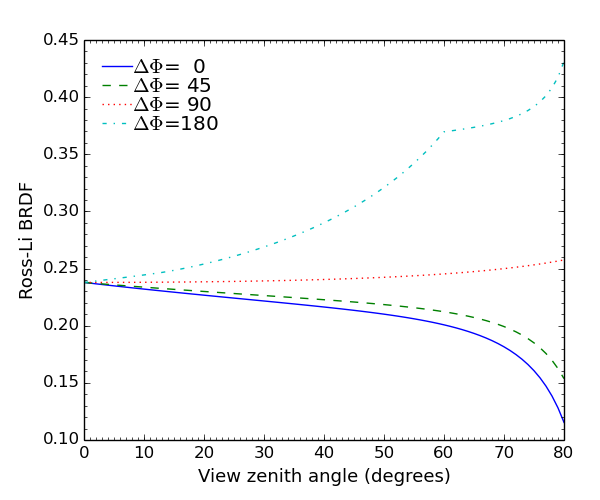
Calling cdisort functions from python
cdisort is a C-implementation of the DISORT algorithm including several improvements and extensions. The functions in cdisort may be made available in python using swig. An example calculating the RossLi BRDF is shown here. The following steps are the only needed to run the example:
- Generate a swig interface file.
- swig, compile and make shared library.
- Run python script.
Below it is assumed that the libRadtran package is installed and that you do cd libradtran-version-number; mkdir pyuvspec; cd pyuvspec. All commands below should be executed from the pyuvspec directory.
Generate a swig interface file
The swig interface file for this example looks as follows (save it in a file named cdisort.i to run the examples below):
%module cdisort
%{
#include "cdisort.h"
#include "locate.h"

  rossli_brdf_spec *RossLiBRDFSpec(){
    rossli_brdf_spec *brdf ;
    brdf = (rossli_brdf_spec *)calloc(1,sizeof(rossli_brdf_spec));
    return brdf;
  }

%}

%include "cdisort.h"

rossli_brdf_spec *RossLiBRDFSpec();
swig, compile and make shared library
This is simple, just save below content in a file named Makefile and type make.
LIBSRC_C = ../libsrc_c/
LIBSRC_C_H = ../libsrc_c

all:
	swig -python -I$(LIBSRC_C) cdisort.i
	gcc -c $(LIBSRC_C)locate.c -I$(LIBSRC_C) -I/usr/include/python2.7 -fPIC -o locate.o
	gcc -c $(LIBSRC_C)cdisort.c -I$(LIBSRC_C) -I/usr/include/python2.7 -fPIC -o cdisort.o
	gcc -c $(LIBSRC_C)disotest.c -I$(LIBSRC_C) -I/usr/include/python2.7 -fPIC -o disotest.o
	gcc -c cdisort_wrap.c -I/usr/include/python2.7 -fPIC
	ld -shared locate.o cdisort.o  disotest.o cdisort_wrap.o -o _cdisort.so
Run python script
Run the below python script to produce the following figure:
import numpy as np
import cdisort as dis

Plot=True
if Plot:
    import matplotlib.pyplot as plt
    from matplotlib.ticker import MultipleLocator, FormatStrFormatter
    xsize = 6
    ysize = 5
    fig = plt.figure(figsize=(xsize,ysize))
    ax = fig.add_axes([0.14,0.12,.8,0.8])
    fsize=13
    pl_list=[]
    labels =[]
    colours    = ['b','g','r','c']
    linestyles = ['-','--',':','-.']

AngleOfIncidence = 60.0

# Initalize brdf to be of a type that is accepted by c_bidir_reflectivity_rossli
# See cdisort.i how to do this.
brdf = dis.RossLiBRDFSpec()
brdf.iso = 0.091
brdf.geo = 0.01
brdf.rossli_hotspot = 1
brdf.vol = 0.02

mu   = np.cos(np.deg2rad(AngleOfIncidence))
dphis = np.deg2rad(np.array([0,45,90,180]))
ViewAngles = np.arange(0,81,1)
mups       = np.cos(np.deg2rad(ViewAngles))

i=0
for dphi in dphis:
    RossLis = []
    for mup,ViewAngle in zip(mups,ViewAngles):
        RossLi = dis.c_bidir_reflectivity_rossli (brdf, mu, mup, dphi )
        RossLis.append(RossLi)
    RossLis=np.array(RossLis)
    if Plot:
        pl,  =plt.plot(ViewAngles,RossLis,color=colours[i],linestyle=linestyles[i])
        pl_list.append(pl)
        labels.append('$\Delta\Phi$='+'{:3.0f}'.format(np.rad2deg(dphi)))
    i+=1


if Plot:
    ax.set_xlabel('View zenith angle (degrees)', fontsize = fsize)
    ax.set_ylabel('Ross-Li BRDF', fontsize = fsize)
    title=''
    xmaL=10
    xmiL=1
    ymaL=0.05
    ymiL=0.01
    xmajorLocator   = MultipleLocator(xmaL)
    xminorLocator   = MultipleLocator(xmiL)
    ax.xaxis.set_minor_locator(xminorLocator)
    ax.xaxis.set_major_locator(xmajorLocator)
    ymajorLocator   = MultipleLocator(ymaL)
    ax.yaxis.set_major_locator(ymajorLocator)
    yminorLocator   = MultipleLocator(ymiL)
    ax.yaxis.set_minor_locator(yminorLocator)

    l=plt.legend(pl_list,labels,
                 ncol=1, loc='upper left',
                 columnspacing=1.0, labelspacing=0.0,
                 handletextpad=0.0, handlelength=1.5,
                 fancybox=False, shadow=False, numpoints=1,
                 title=title)
    l.draw_frame(False)


    plt.show()
|
|