Source-receptor matrix calculation for deposited mass
Existing Lagrangian particle dispersion models are capable of establishing source receptor relationships by running either forward or backward in time. For receptor-oriented studies such as interpretation of "point" measurement data, backward simulations can be computationally more efficient by several orders of magnitude. However, to date, the backward modelling capabilities have been limited to atmospheric concentrations or mixing ratios. In this paper, we extend the backward modelling technique to substances deposited at the Earth's surface by wet scavenging and dry deposition. This facilitates efficient calculation of emission sensitivities for deposition quantities at individual sites, which opens new application fields such as the comprehensive analysis of measured deposition quantities, or of deposition recorded in snow samples or ice cores. This could also include inverse modelling of emission sources based on such measurements. We have tested the new scheme as implemented in the Lagrangian particle dispersion model FLEXPART v10.2 by comparing results from forward and backward calculations. We also present an example application for black carbon concentrations recorded in Arctic snow. More information can be found in:

Eckhardt, S., Cassiani, M., Evangeliou, N., Sollum, E., Pisso, I., and Stohl, A Source-receptor matrix calculation for deposited mass with the Lagrangian particle dispersion model FLEXPART v10.2 in backward mode Geosci. Model Dev., 10, 4605-4618, https://doi.org/10.5194/gmd-10-4605-2017  

Current model capabilities for simulating black carbon and sulfate concentrations in the Arctic atmosphere
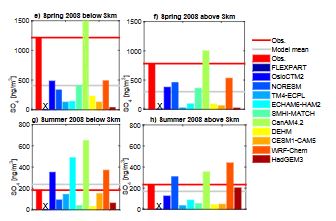
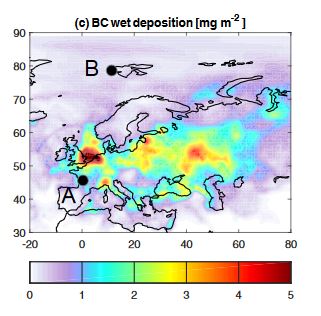
The concentrations of sulfate, black carbon (BC) and other aerosols in the Arctic are characterized by high values in late winter and spring (so-called Arctic Haze) and low values in summer. Models have long been struggling to capture this seasonality and especially the high concentrations associated with Arctic Haze. In this study, we evaluate sulfate and BC concentrations from eleven different models driven with the same emission inventory against a comprehensive pan-Arctic measurement data set over a time period of 2 years (2008–2009). The set of models consisted of one Lagrangian particle dispersion model, four chemistry transport models (CTMs), one atmospheric chemistry-weather forecast model and five chemistry climate models (CCMs), of which two were nudged to meteorological analyses and three were running freely. The measurement data set consisted of surface measurements of equivalent BC (eBC) from five stations (Alert, Barrow, Pallas, Tiksi and Zeppelin), elemental carbon (EC) from Station Nord and Alert and aircraft measurements of refractory BC (rBC) from six different campaigns. We find that the models generally captured the measured eBC or rBC and sulfate concentrations quite well, compared to previous comparisons. However, the aerosol seasonality at the surface is still too weak in most models. Concentrations of eBC and sulfate averaged over three surface sites are underestimated in winter/spring in all but one model (model means for January - March underestimated by 59 and 37 % for BC and sulfate, respectively), whereas concentrations in summer are overestimated in the model mean (by 88 and 44 % for July to September), but with overestimates as well as underestimates present in individual models. The most pronounced eBC underestimates, not included in the above multisite average, are found for the station Tiksi in Siberia where the measured annual mean eBC concentration is 3 times higher than the average annual mean for all other stations. This suggests an underestimate of BC sources in Russia in the emission inventory used. Based on the campaign data, biomass burning was identified as another cause of the modeling problems. For sulfate, very large differences were found in the model ensemble, with an apparent anti-correlation between modeled surface concentrations and total atmospheric columns. There is a strong correlation between observed sulfate and eBC concentrations with consistent sulfate/eBC slopes found for all Arctic stations, indicating that the sources contributing to sulfate and BC are similar throughout the Arctic and that the aerosols are internally mixed and undergo similar removal. However, only three models reproduced this finding, whereas sulfate and BC are weakly correlated in the other models. Overall, no class of models (e.g., CTMs, CCMs) performed better than the others and differences are independent of model resolution. More information can be found in:

Eckhardt, S., B. Quennehen, D. J. L. Olivie, T. K. Berntsen, R. Cherian, J. H. Christensen, W. Collins, S. Crepinsek, N. Daskalakis, M. Flanner, A. Herber, C. Heyes, O. Hodnebrog, L. Huang, M. Kanakidou, Z. Klimont, J. Langner, K. S. Law, M. T. Lund, R. Mahmood, A. Massling, S. Myriokefalitakis, I. E. Nielsen, J. K. Nojgaard, J. Quaas, P. K. Quinn, J.-C. Raut, S. T. Rumbold, M. Schulz, S. Sharma, R. B. Skeie, H. Skov, T. Uttal, K. von Salzen, and A. Stohl Current model capabilities for simulating black carbon and sulfate concentrations in the Arctic atmosphere: a multi-model evaluation using a com-prehensive measurement data set. Atmos. Chem. Phys. 15, 9413-9433, doi:10.5194/acp-15-9413-2015  

The influence of cruise ship emissions on air pollution in Svalbard
we have analyzed whether tourist cruise ships have an influence on measured sulfur dioxide (SO2), ozone (O3), Aitken mode particle and equivalent black carbon (EBC) concentrations at Ny Alesund and Zeppelin Mountain on Svalbard in the Norwegian Arctic during summer. We separated the measurement data set into periods when ships were present and periods when ships were not present in the Kongsfjord area, according to a long-term record of the number of passengers visiting Ny Alesund. We show that when ships with more than 50 passengers cruise in the Kongsfjord, measured daytime mean concentrations of 60 nm particles and EBC in summer show enhancements of 72 and 45%, respectively, relative to values when ships are not present. Even larger enhancements of 81 and 72% were found for stagnant conditions. In contrast, O3 concentrations were 5% lower on average and 7% lower under stagnant conditions, due to titration of O3 with the emitted nitric oxide (NO). The differences between the two data subsets are largest for the highest measured percentiles, while relatively small differences were found for the median concentrations, indicating that ship plumes are sampled relatively infrequently even when ships are present although they carry high pollutant concentrations. We estimate that the ships increased the total summer mean concentrations of SO2, 60 nm particles and EBC by 15, 18 and 11%, respectively. Our findings have two important implications. Firstly, even at such a remote Arctic observatory as Zeppelin, the measurements can be influenced by tourist ship emissions. Careful data screening is recommended before summertime Zeppelin data is used for data analysis or for comparison with global chemistry transport models. However, Zeppelin remains as one of the most valuable Arctic observatories, as most other Arctic observatories face even larger local pollution problems. Secondly, given landing statistics of tourist ships on Svalbard, it is suspected that large parts of the Svalbard archipelago are affected by cruise ship emissions. Thus, our results may be taken as a warning signal of future pan-Arctic conditions if Arctic shipping becomes more frequent and emission regulations are not strict enough. More information can be found in:

Eckhardt, S., O. Hermansen, H. Grythe, M. Fiebig, K. Stebel, M. Cassiani, A. Baecklund, and A. Stohl The influence of cruise ship emissions on air pollution in Svalbard - a harbinger of a more polluted Arctic? Atmos. Chem. Phys. 13, 8401-8409, 2013  

Source regions of some persistent organic pollutants measured in the atmosphere at Birkenes, Norway
A key feature of POPs (Persistent Organic Pollutants) is their potential for long-range atmospheric transport. In order to better understand and predict atmospheric source-receptor relationships of POPs, we have modified an existing Lagrangian transport model (FLEXPART) to include some of the key processes that control the atmospheric fate of POPs. We also present four years (2004-2007) of new atmospheric measurement data for polychlorinated biphenyls (PCBs) and hexachlorocyclohexanes (HCHs) obtained at Birkenes, an EMEP (European Monitoring and Evaluation Programme) site in southern Norway. The model overestimates measured PCB-28 and gamma-HCH concentrations by factors of 2 and 8, respectively, which is most likely because the emissions used as input to the model are overestimated. FLEXPART captures the temporal variability in the measurements very well and, depending on season, explains 31-67% (14-62%) of the variance of measured PCB-28 (gamma-HCH) concentrations. FLEXPART, run in a time-reversed (adjoint) mode, was used to identify the source regions responsible for the POP loading at the Birkenes station. Emissions in Central Europe and Eastern Europe contributed 32% and 24%, respectively, to PCB-28 at Birkenes, while Western Europe was found to be the dominant source (50%) for gamma-HCH. Intercontinental transport from North America contributed 13% gamma-HCH. While FLEXPART has no treatment of the partitioning of POPs between different surface media, it was found a very useful tool for studying atmospheric source-receptor relationships for POPs and POP-like chemicals that do not sorb strongly to atmospheric particles and whose atmospheric levels are believed to be mainly controlled by primary sources. More information can be found in:

Eckhardt, S., K. Breivik, Y. F. Li, S. Mano, and A. Stohl: Source regions of some persistent organic pollutants measured in the atmosphere at Birkenes, Norway Atmospheric Chemistry and Physics, 9(17), 6597-6610, 2009.  

Estimation of the Emission Profile of an Volcanic eruption
An analytical inversion method has been developed to estimate the vertical profile of SO2 emissions from volcanic eruptions. The method uses satellite-observed total SO2 columns and an atmospheric transport model (FLEXPART) to exploit the fact that winds change with altitude - thus, the position and shape of the volcanic plume bear information on its emission altitude. The method finds the vertical emission distribution which minimizes the total difference between simulated and observed SO2 columns while also considering a priori information. We have tested the method with the eruption of Jebel at Tair, Yemen, on 30 September 2007 for which a comprehensive observational data set from various satellite instruments (AIRS, OMI, SEVIRI, CALIPSO) is available. Using satellite data from the first 24 h after the eruption for the inversion, we found an emission maximum near 16 km above sea level (a.s.l.), and secondary maxima near 5, 9, 12 and 14 km a.s.l. 60% of the emission occurred above the tropopause. The emission profile obtained in the inversion was then used to simulate the transport of the plume over the following week. The modeled plume agrees very well with SO2 total columns observed by OMI, and its altitude agrees with CALIPSO aerosol observations to within 1-2 km. The inversion result is robust against various changes in both the a priori and the observations. Even when using only SEVIRI data from the first 15 h after the eruption, the emission profile was reasonably well estimated. The method is computationally very fast. It is therefore suitable for implementation within an operational environment, such as the Volcanic Ash Advisory Centers, to predict the threat posed by volcanic ash for air traffic. It could also be helpful for assessing the sulfur input into the stratosphere, be it in the context of volcanic processes or also for proposed geo-engineering techniques to counteract global warming. Transport pathways derived from the 15-year climatology of tracerddd More information can be found in:

Eckhardt, S., A. J. Prata, P. Seibert, K. Stebel, and A. Stohl Estimation of the vertical profile of sulfur dioxide injection into the atmosphere by a volcanic eruption using satellite column measurements and inverse transport modeling, Atmos. Chem. Phys., 8(14), 3881-3897, 2008.  

Record high peaks in PCBs due to atmsopheric long-range transport of biomass burning emissions
  The story at Environmental Researchweb:     Peaks in levels of polychlorinated biphenyls (PCBs) in the Arctic atmosphere could be due to burning of biomass in areas such as Eastern Europe and North America. That's according to researchers from the Norwegian Institute for Air Research and the University of Oslo, Norway....
Courtesy Ann-Christine Engvall, view from measurement station Zeppelin during (non) fire influenced period Soils and forests in the boreal region of the northern hemisphere are recognised as having a large capacity for storing air-borne Persistent Organic Pollutants (POPs), such as the polychlorinated biphenyls (PCBs). Following reductions of primary emissions of various legacy POPs, there is an increasing interest and debate about the relative importance of secondary re-emissions on the atmospheric levels of POPs. In spring of 2006, biomass burning (BB) emissions from agricultural fires in Eastern Europe were transported to the Zeppelin station on Svalbard, where record-high levels of many air pollutants were recorded. Here we report on the extremely high concentrations of PCBs that were also measured during this period. 21 out of 32 PCB congeners were enhanced by more than two standard deviations above the long-term mean concentrations. In July 2004, about 5.8 million hectare of boreal forest burned in North America, emitting a pollution plume which reached the Zeppelin station after a travel time of 3-4 weeks. Again, 12 PCB congeners were elevated above the long-term mean by more than two standard deviations, with the less chlorinated congeners being most strongly affected. We propose that these abnormally high concentrations were caused by BB emissions.

Eckhardt, S., K. Breivik, S. Manoe, A. Stohl: Record high peaks in PCB concentrations in the Arctic atmosphere due to long-range transport of biomass burning emissions, Atmos. Chem. Phys. , 7, 4527-4536, 2007.  

Transport Pathways as derived from a 15-Year Climatology of Tracer Transport
Transport pathways derived from the 15-year climatology of tracer transport as simulated with FLEXPART. The green arrows show typical transport pathways below 3 km and the black arrows indicate pathways above 3 km. These transport pathways show differences during extreme phases of the North Atlantic Oscillation. During high phases of the NAO more tracer is found in the Arctic. Movies of tracer transport are shown at: http://www.forst.tu-muenchen.de/EXT/LST/METEO/arcticpollution/ More information can be found in:

Eckhardt, S., A. Stohl, S. Beierle, N. Spichtinger, P. James, C. Forster, C. Junker, T. Wagner, U. Platt, and S. G. Jennings, 2003: The North Atlantic Oscillation controls air pollution transport to the Arctic, Atmos. Chem. Phys., 3, 1769-1778, 2003.  


A 15-Year Climatology of Warm Conveyor Belts
Eckhardt, S., A, Stohl, H. Wernli, P. James, C. Forster and N. Spichtinger, A 15-Year Climatology of Warm Conveyor Belts, J. Climate, 17, 218-237, 2004.