
Example applications
Land-biosphere Fluxes of CO2 in Europe
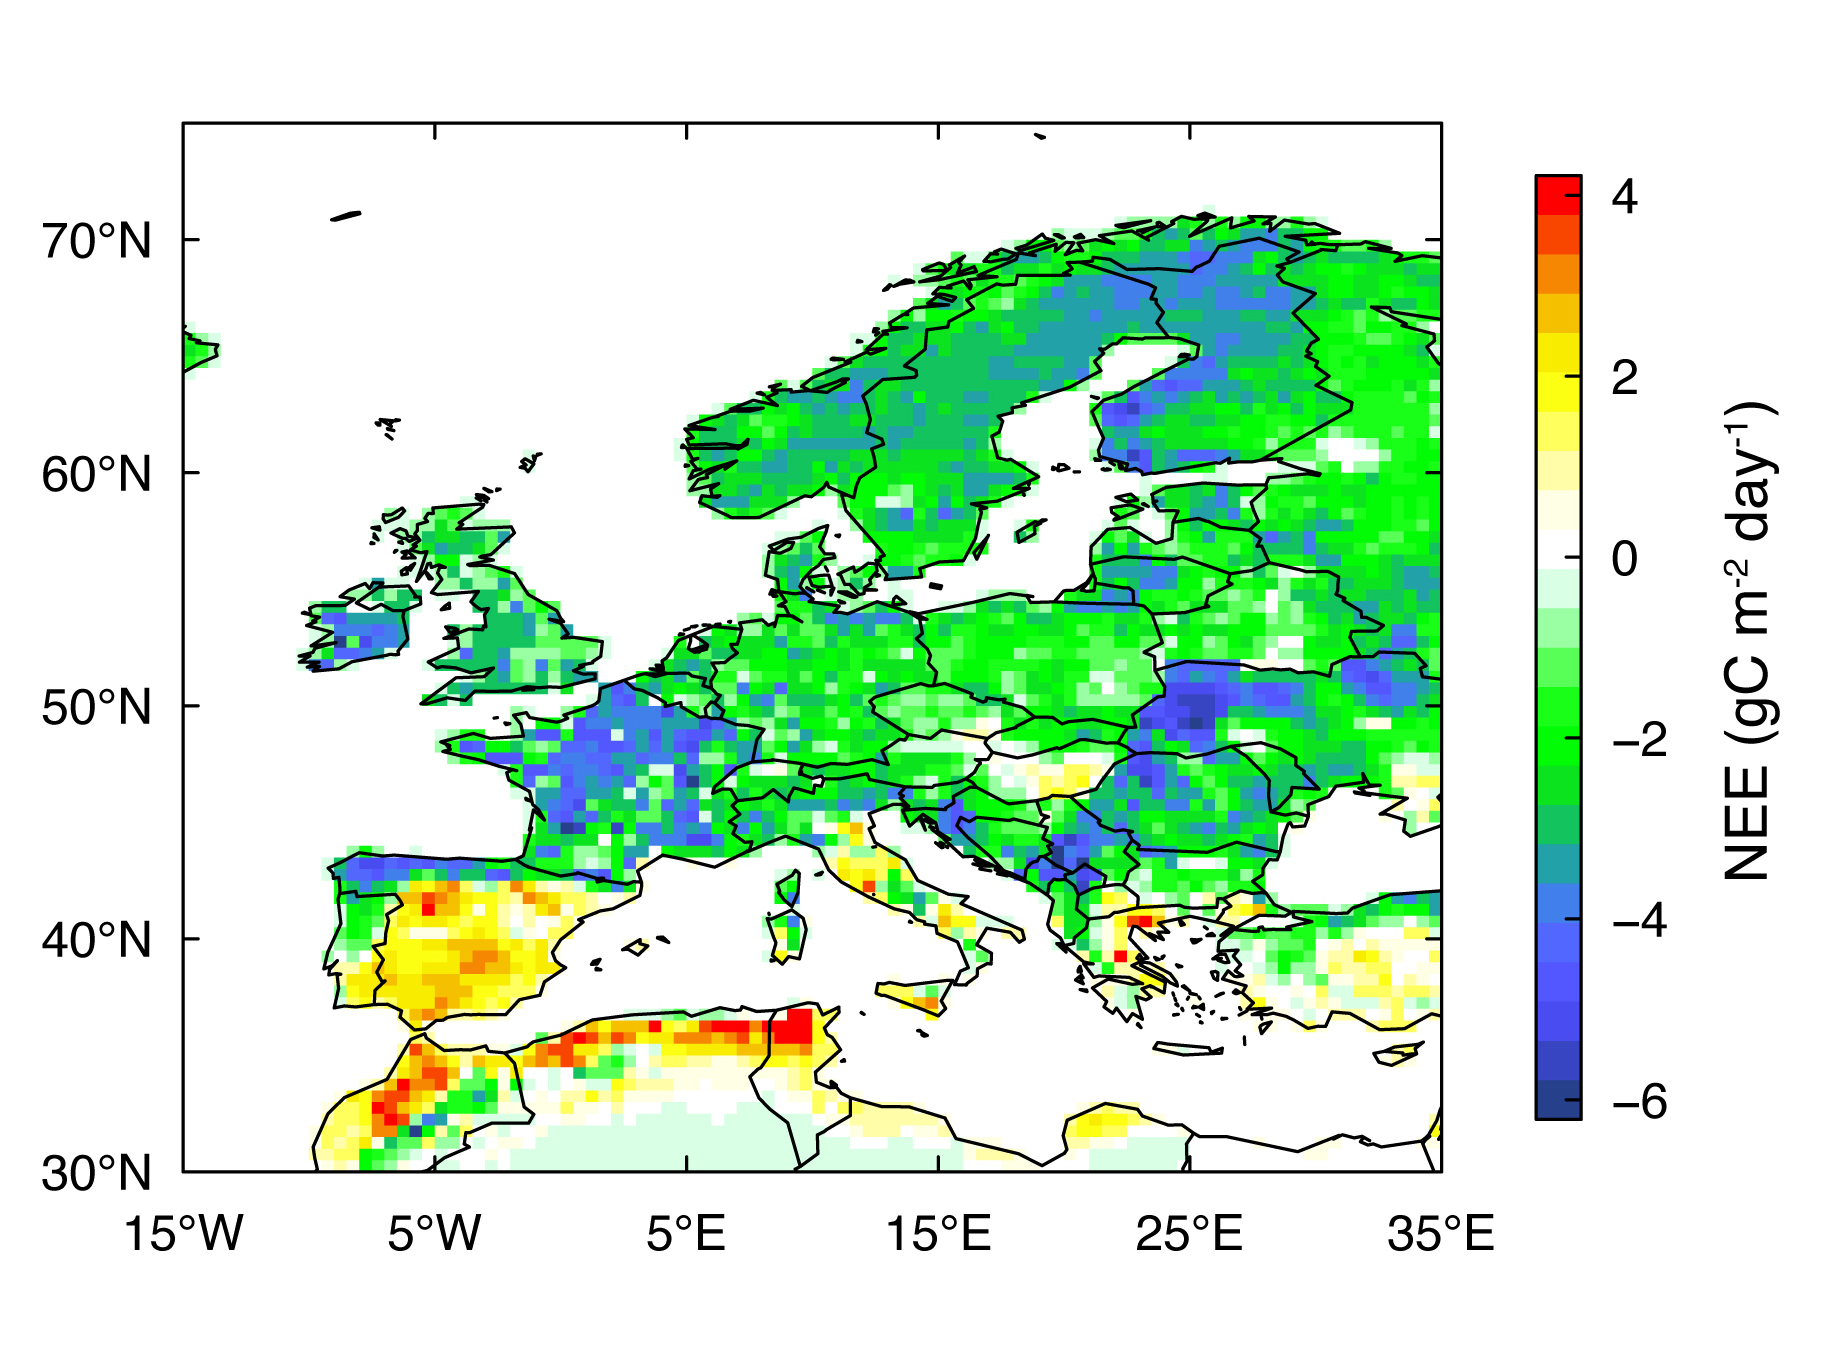 Land biosphere fluxes of CO2, specifically the Net Ecosystem Exchange (NEE), were estimated over Europe from 2006 to 2015.
The prior NEE was based on the land ecosystem model ORCHIDEE and was given at 3-hourly and 0.5 degrees resolution. In the
inversion the offset from the prior was optimised at 6-hourly intervals which were averaged over 5 days. Since atmospheric
CO2 observations are also influenced by fossil fuel and biomass burning emissions, as well as air-sea CO2
exchange, estimates of these fluxes were used in addition to estimate their influence on CO2 mixing ratios. The figure
shows the mean NEE for July 2012 estimated by FlexInvert (note that a positive NEE is a flux to the atmosphere).
Land biosphere fluxes of CO2, specifically the Net Ecosystem Exchange (NEE), were estimated over Europe from 2006 to 2015.
The prior NEE was based on the land ecosystem model ORCHIDEE and was given at 3-hourly and 0.5 degrees resolution. In the
inversion the offset from the prior was optimised at 6-hourly intervals which were averaged over 5 days. Since atmospheric
CO2 observations are also influenced by fossil fuel and biomass burning emissions, as well as air-sea CO2
exchange, estimates of these fluxes were used in addition to estimate their influence on CO2 mixing ratios. The figure
shows the mean NEE for July 2012 estimated by FlexInvert (note that a positive NEE is a flux to the atmosphere).
Emissions of CH4 in the Arctic and sub-Arctic
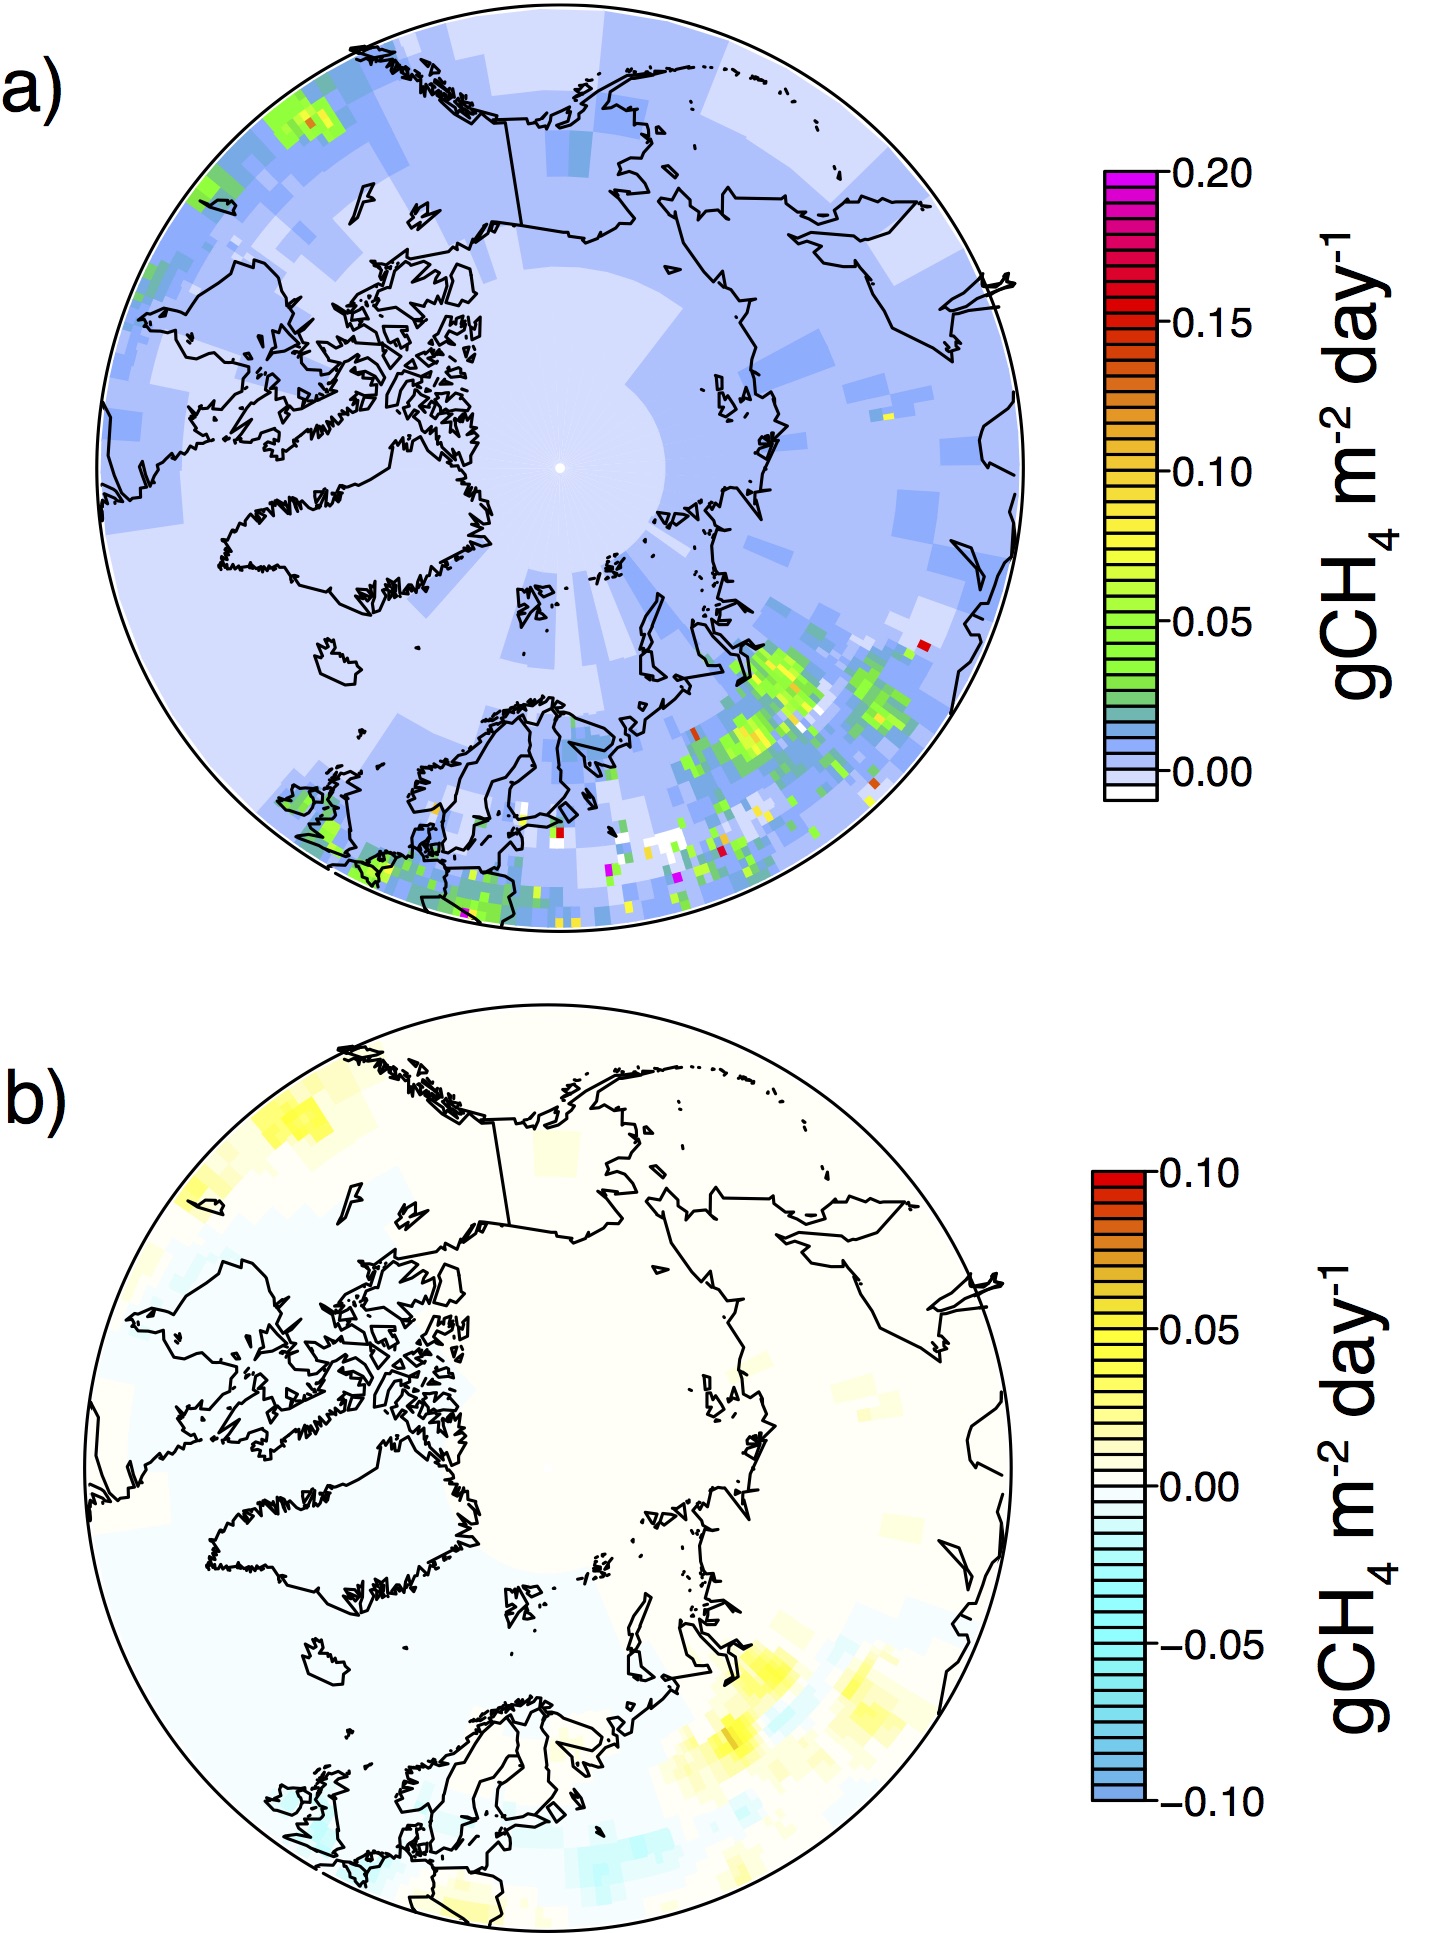 Emissions of CH4 were estimated north of 50°N for 2005 to 2013 using a network of 22 atmospheric stations. The fluxes were
optimised monthly on a grid of variable resolution with a maximum resolution of 1 degree. A CH4 source of 82-84 Tg/y was found for
the whole Arctic and sub-Arctic, which is approximately 15% of the global source. Emissions were found from natural sources, predominantly wetlands,
such as in the Hudson Bay region on North America and the Western Siberian Lowlands, as well as anthropogenic sources, predominantly oil and
gas industries, such as in the province of Alberta, Canada and in Western Siberia. Figure (a) shows the optimised fluxes and figure (b)
shows the difference between the posterior and prior flux. The inversion shows a significant increase in the emissions from Alberta, Canada
and in Western Siberia, and a small decrease over Eastern Europe and the UK.
This study is published in Thompson et al., Atmos. Chem. Phys. (2017)
Emissions of CH4 were estimated north of 50°N for 2005 to 2013 using a network of 22 atmospheric stations. The fluxes were
optimised monthly on a grid of variable resolution with a maximum resolution of 1 degree. A CH4 source of 82-84 Tg/y was found for
the whole Arctic and sub-Arctic, which is approximately 15% of the global source. Emissions were found from natural sources, predominantly wetlands,
such as in the Hudson Bay region on North America and the Western Siberian Lowlands, as well as anthropogenic sources, predominantly oil and
gas industries, such as in the province of Alberta, Canada and in Western Siberia. Figure (a) shows the optimised fluxes and figure (b)
shows the difference between the posterior and prior flux. The inversion shows a significant increase in the emissions from Alberta, Canada
and in Western Siberia, and a small decrease over Eastern Europe and the UK.
This study is published in Thompson et al., Atmos. Chem. Phys. (2017)
Sources of black carbon to the Arctic
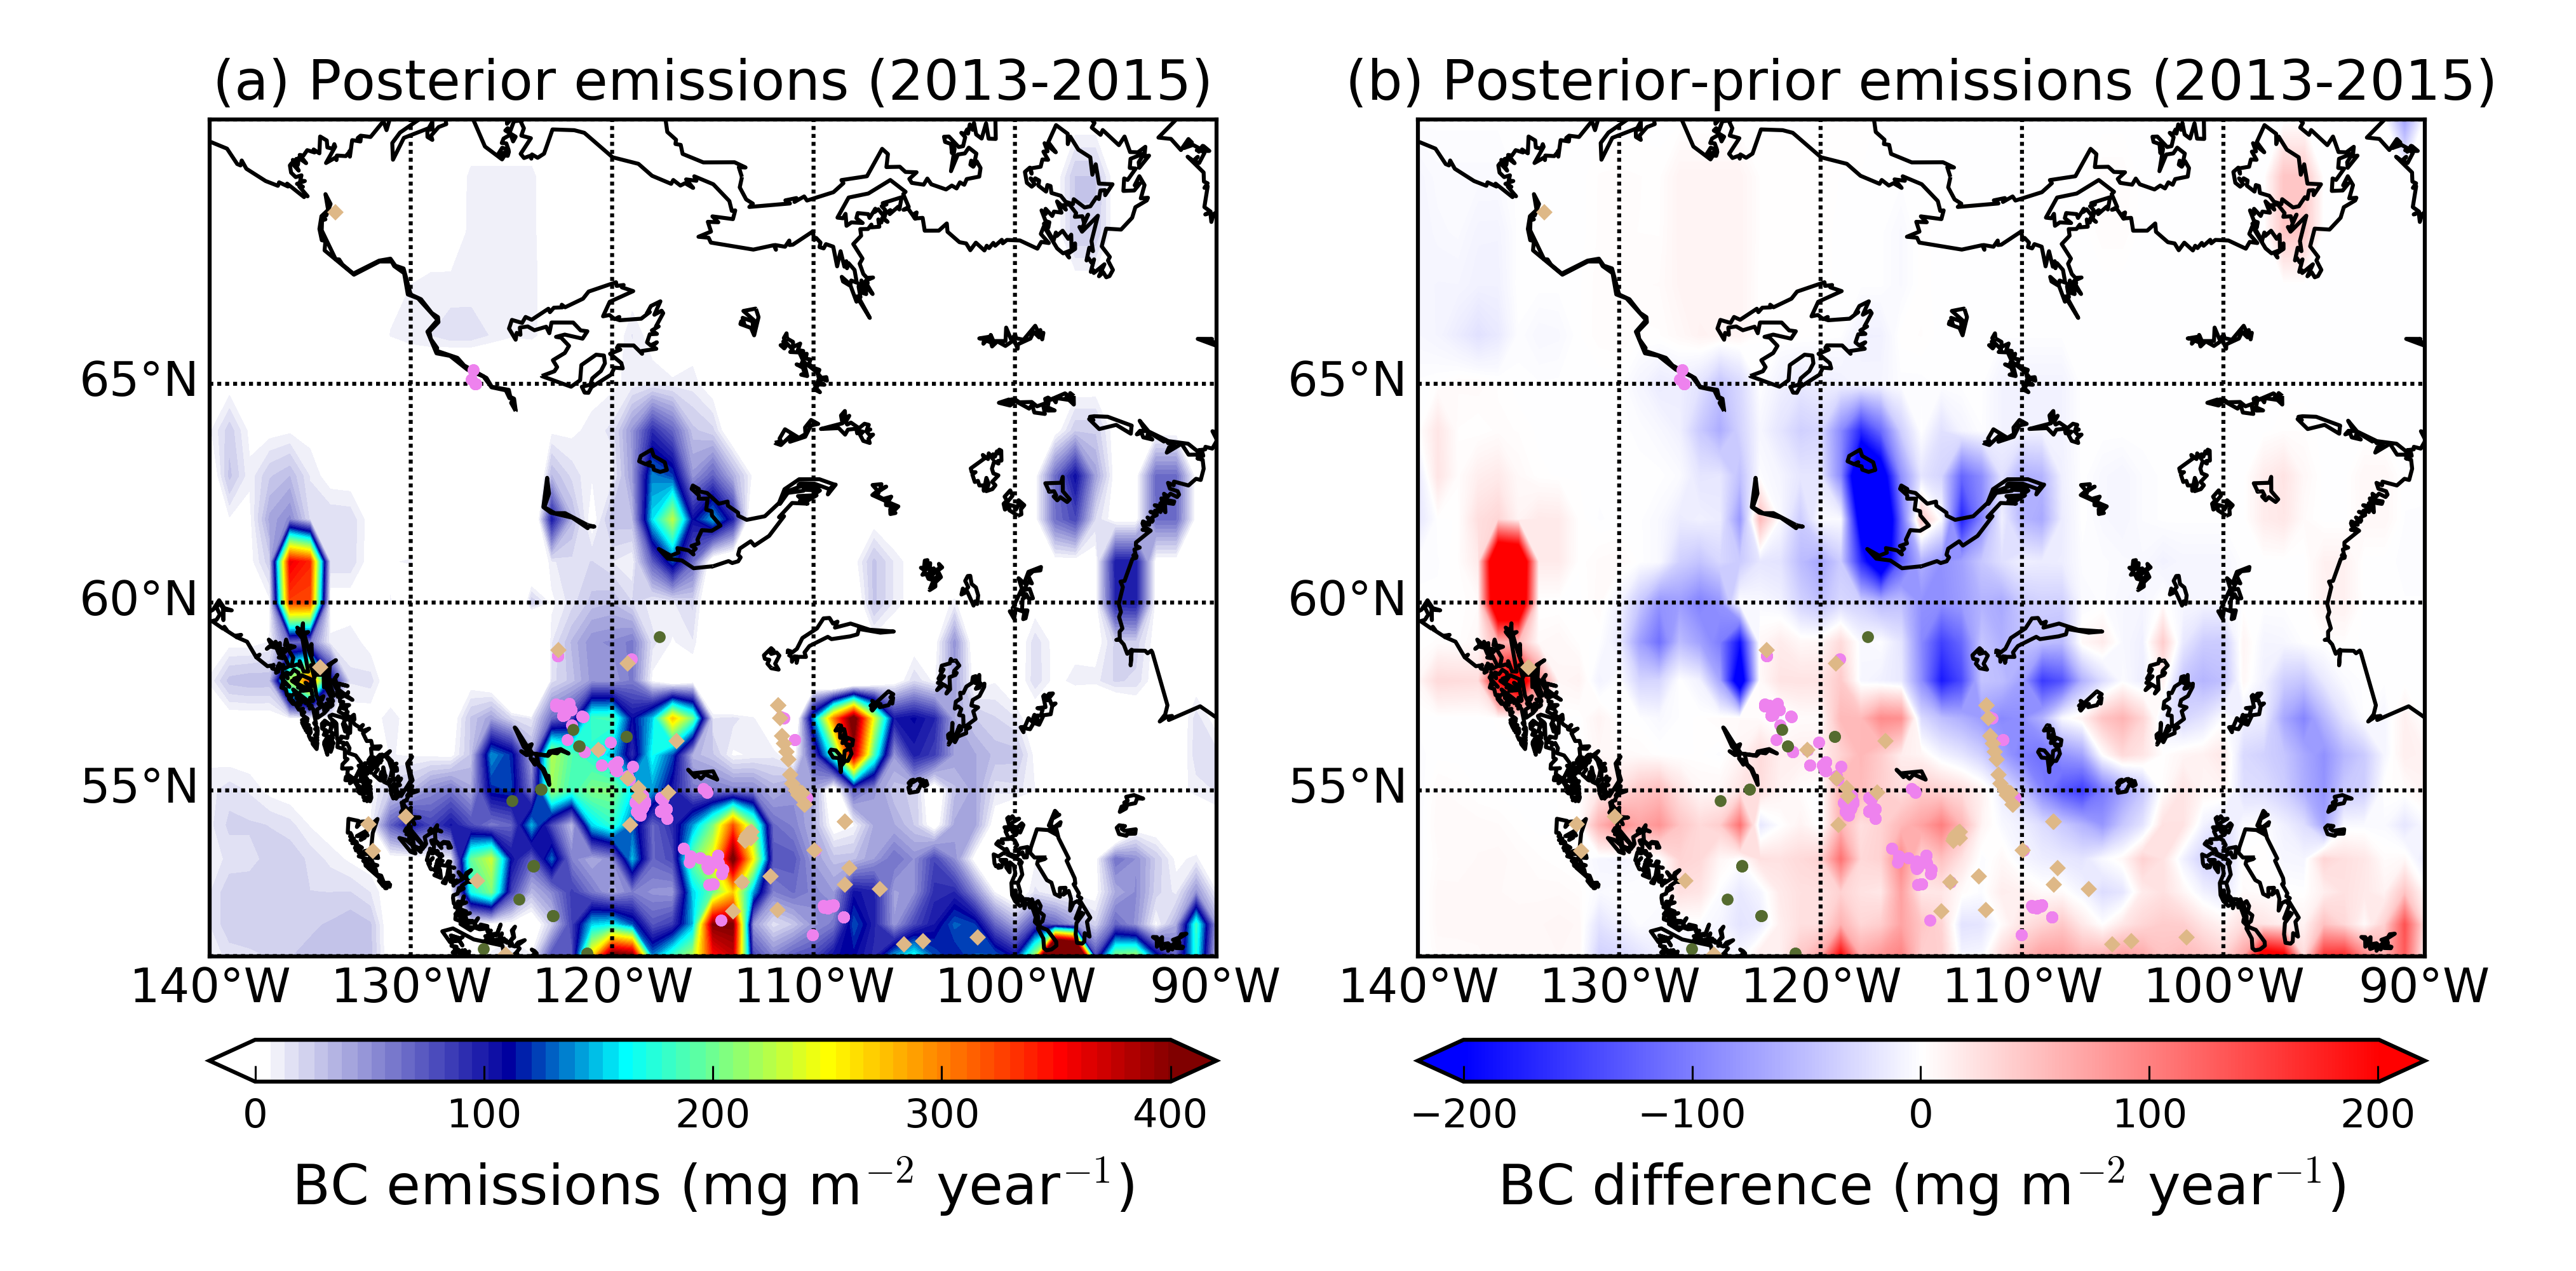 Black carbon (BC) is emitted by incomplete combustion of organic matter and has sources from e.g. wildfires and gas flares. BC emissions
were estimated for the mid to high northern latitudes (>50°N) for 2013 to 2015. The annual emissions from the inversion were substantially
smaller (560 ± 171 kt/y) than the prior estimate. In Europe, the largest sources were megacities and biomass burning, while in Siberia they were
from gas flaring. Figure (a) shows the optimised emissions from North America and the purple points on the map indicate the locations of gas
flaring industries. Figure (b) shows the difference between the posterior and prior emissions. This study is published in
Evangeliou et al., Atmos. Chem. Phys. (2018)
Black carbon (BC) is emitted by incomplete combustion of organic matter and has sources from e.g. wildfires and gas flares. BC emissions
were estimated for the mid to high northern latitudes (>50°N) for 2013 to 2015. The annual emissions from the inversion were substantially
smaller (560 ± 171 kt/y) than the prior estimate. In Europe, the largest sources were megacities and biomass burning, while in Siberia they were
from gas flaring. Figure (a) shows the optimised emissions from North America and the purple points on the map indicate the locations of gas
flaring industries. Figure (b) shows the difference between the posterior and prior emissions. This study is published in
Evangeliou et al., Atmos. Chem. Phys. (2018)