Examples of applications
Emissions of CH4 in Europe
 FLEXINVERT was used to estimate emissions of CH4 in Europe for 2011. Methane was chosen for this case study as it is an important greenhouse gas and has significant anthropogenic sources. Furthermore, there is only minimal loss (negative emissions) of CH4 at the surface and it has a long atmospheric lifetime of approximately 10 years. For this study, 14 ground-based observation sites were used in the inversion.
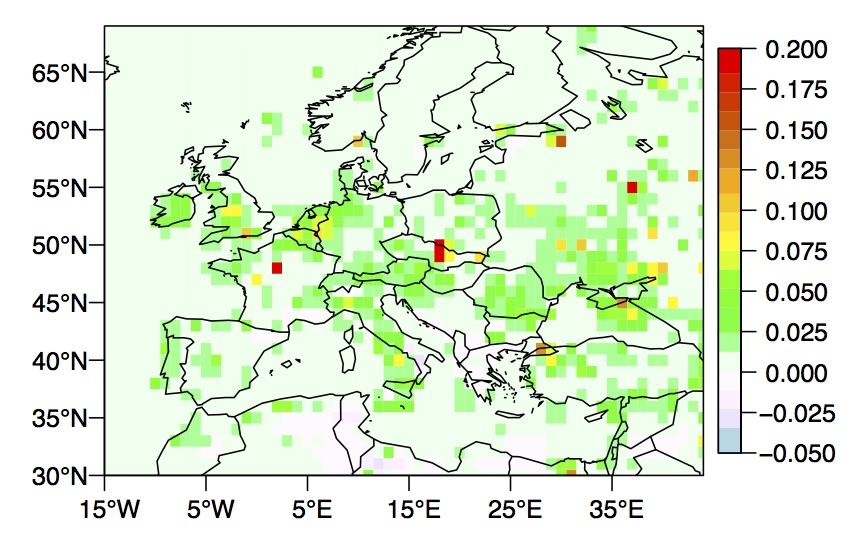
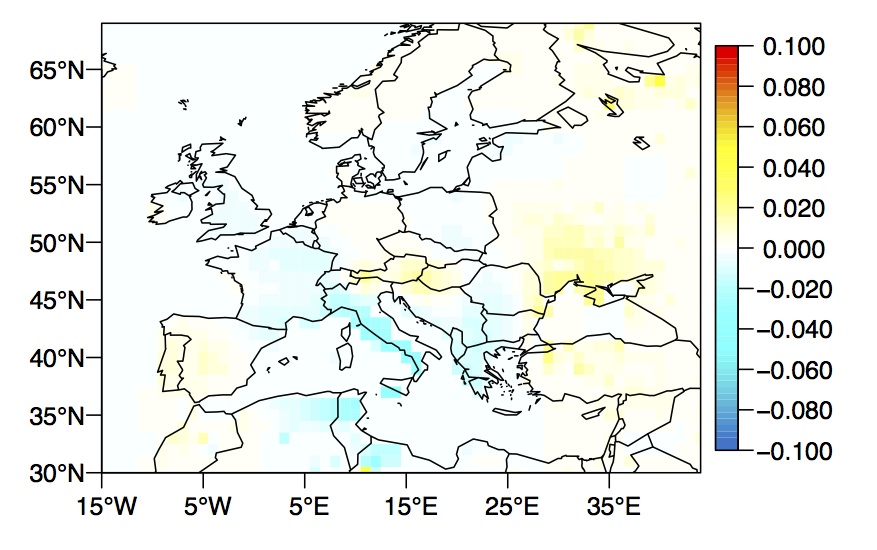
The upper plot on the right shows the posterior (i.e. after inversion) annual mean CH4 emission, while the lower plot shows the difference between the posterior and prior emissions (both in g m-2 day-1). The posterior - prior difference can also be interpreted as the correction made to the prior fluxes based on the information contained in the atmospheric observations. Relative to the prior, the inversion has decreased emissions in France and Italy and increased them in Austria and eastern Europe.
For further details about this inversion refer to Thompson and Stohl, GMD, 2014 (here)
Trends in CH4 emissions in East Asia
 FLEXINVERT was used to estimate CH4 emissions from East Asia from 2000 to 2011; a period when the emissions are thought to have increased rapidly owing largely to increased energy demands.
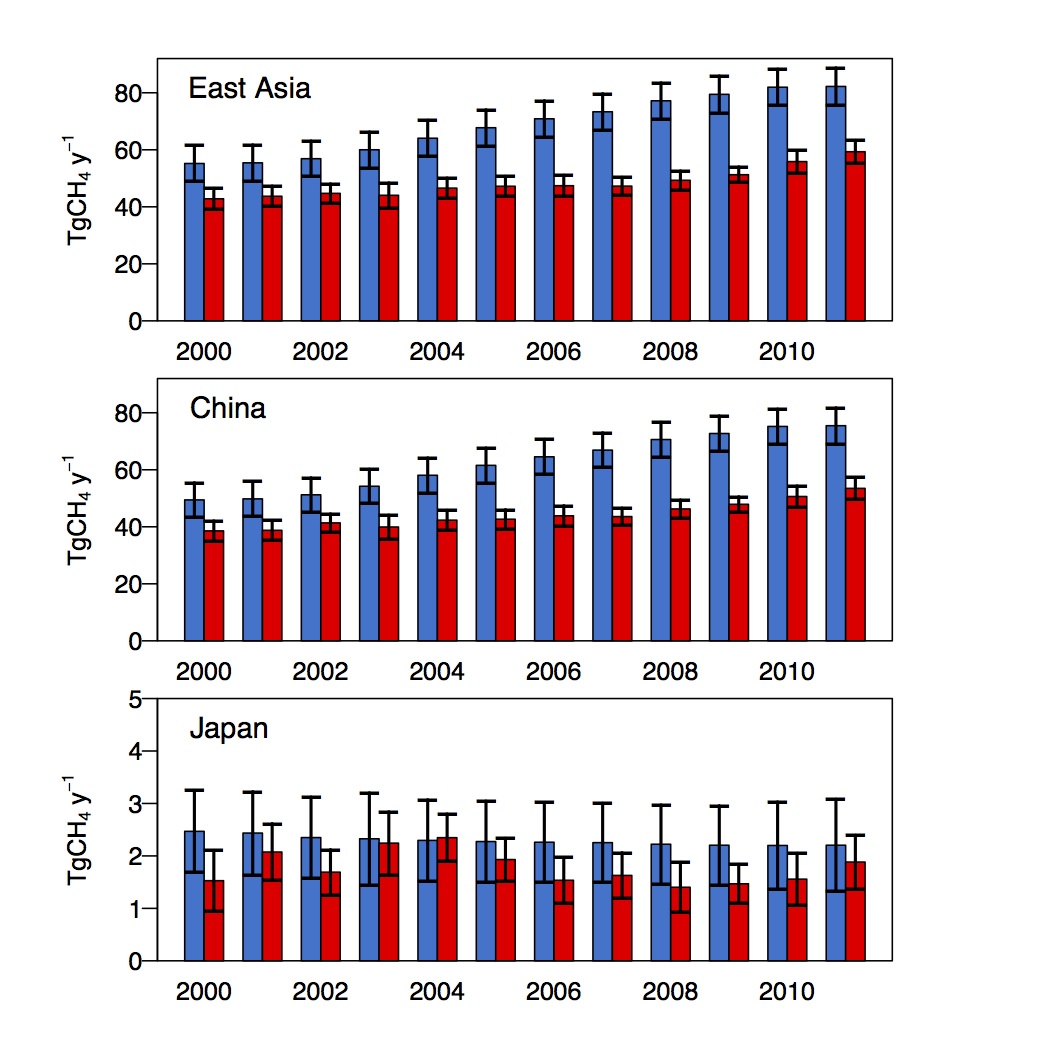
The plot on the right shows the annual total prior (blue) and posterior (red) emissions for East Asia as a whole as well as for China and Japan. The inversion finds significantly lower emissions compared to the prior (EDGAR-v4.2 FT2010 was used for the prior anthropogenic emissions) as well as a lower rate of increase. The rate of increase in emissions found in the inversion, however, is still significant (1.2 Tg CH4 y-1 for the average over 2000 - 2011).
For further details about this inversion refer to Thompson et al., JGR, 2015 (here)